1. Overview
Starting from a single-node docker-compose Prometheus setup with auxiliary multi-node app exporter monitoring, then moving to kube-prometheus (kubectl apply) and kube-prometheus-stack (helm install). The specific environments and business needs for each of these solutions differ. The older solutions can meet monitoring requirements for a single machine or a single Kubernetes cluster.
When there are multiple Kubernetes clusters, the above solutions may not be sufficient. Although Prometheus clusters or federation can be applied to these deployment schemes, how to solve HA? Issues like duplicate monitoring and alerting data pile up, making it very complex to follow the previous approach. Is there a simpler and reliable open-source solution? Thus, I wanted to test and experience Thanos.
Among the officially recommended deployment methods for Thanos, I chose the bitnami-thanos deployment scheme from the third-party community. Thanos is quite complex when detailed, with sidecar and receiver modes for metric collection. Their differences can be referenced in 1 and 2. Based on my situation, I chose the sidecar mode. For quick experimentation, I ran a pod NFS on a single virtual machine locally, and Minio used the NFS storageClass. kube-prometheus and grafana also used Bitnami’s Helm deployment scheme.
| Experiment Environment | Information | Notes |
|---|---|---|
| IP | 10.66.253.248 | Kubernetes single-node, 6 cores 16Gi RAM |
| k8s version | v1.23.1 | |
| helm version | v3.6.3 | |
| containerd container | v1.4.11 | |
| storageClass Name | nfs-client |
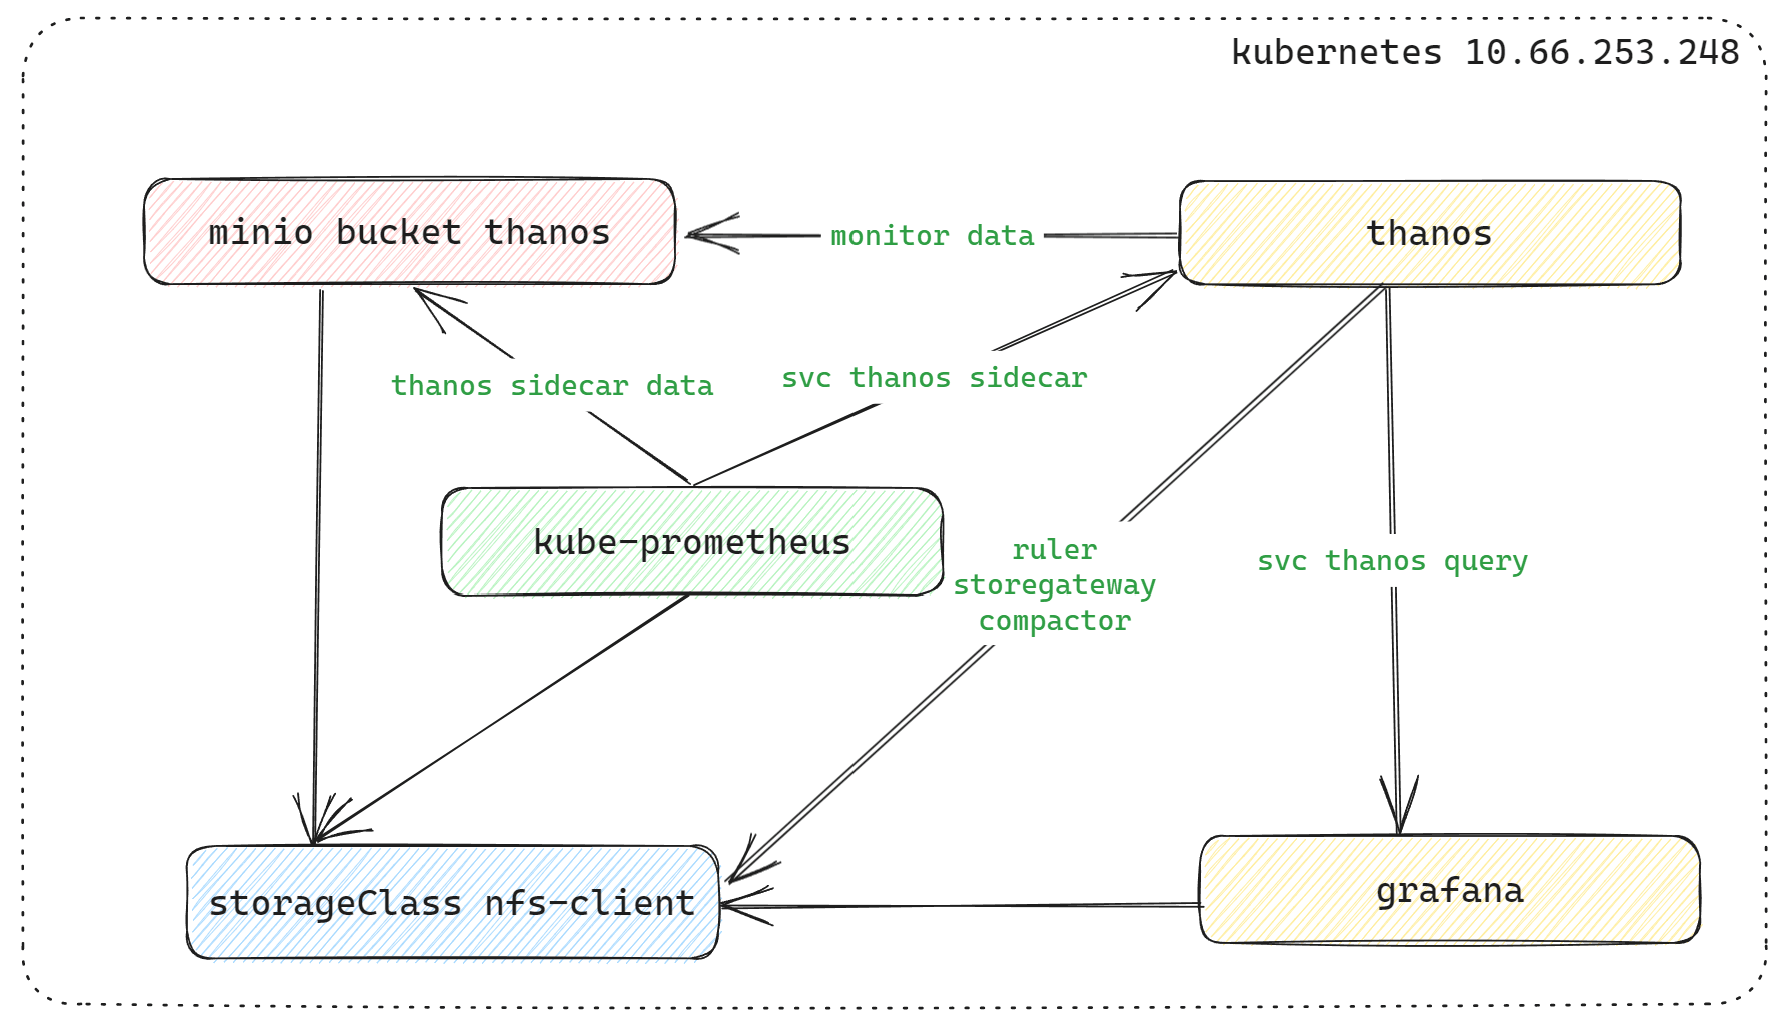
By default, all namespaces are under monitoring, requiring deployment of Minio, kube-prometheus, Thanos, and Grafana.
2. Deployment
2.1 minio
helm repo add c7n https://openchart.choerodon.com.cn/choerodon/c7n/
helm repo update
helm pull c7n/minio --version 5.0.9
tar -xf  minio-5.0.9.tgz
cd minio
Modify some values.yaml configurations in the tgz archive based on the content.
-
- storageClass: “nfs-client”
-
- replicas: 16 ----> replicas: 4
-
- minio-console ingress, not modified for quick deployment
-
- accessKey can also be modified, not modified
helm package ./
helm install minio minio-5.0.9.tgz --namespace=monitoring
Tips after deployment:
***
export MC_HOST_minio-local=http://$(kubectl get secret --namespace monitoring minio -o jsonpath="{.data.rootUser}" | base64 --decode):
$(kubectl get secret --namespace monitoring minio -o jsonpath="{.data.rootPassword}" | base64 --decode)@localhost:9000
****
mc ls minio-local
You can log in to the minio console web using the current password information, or use the default minio login credentials: console/console123. If you set up nodeport to access the svc minio-console, you can ignore the minio-console ingress configuration below.
ingress minio-console configuration
## minio-console ingress ssl
openssl genpkey -out ssl.key -algorithm RSA -pkeyopt rsa_keygen_bits:2048 -aes-256-cbc
openssl rsa -in ssl.key -out ssl.key
openssl req -new -x509 -days 3650 -key ssl.key -out ssl.crt -subj "/C=GB/L=Chengdu/O=NSFOCUS/CN=www.minio-console.example"

## Create minio-console ingress tls certificate
kubectl create secret tls chart-example-tls --cert=ssl.crt --key=ssl.key -n monitoring

kubectl edit ingress -n monitoring minio-console
## Modify ingress configuration, delete the following two lines of default minio console configuration:
-kubernetes.io/ingress.allow-http: "false"
-nginx.ingress.kubernetes.io/backend-protocol: "HTTPS"
Log in to minio to check the process, and create bucket thanos, create accessKey process (omitted).
2.2 kube-prometheus Deployment
## After MinIO is created, you can create a bucket named thanos.
## Create read and write permissions under the bucket's user, and create an access key for thanos to use.
## Example: The test environment created the following accessKey and secret with readwrite permissions.
accesskey: 9PM45Ca5P****kPKQ2K2
secretkey: X10ac6dcu1Zpw0j*******zlBnkdZ4
Create a thanos-storage-minio.yaml file with the following configuration:
type: s3
config:
  bucket: thanos
  endpoint: minio.monitoring.svc.cluster.local:9000
  access_key: 9PM45Ca5P****kPKQ2K2
  secret_key: X10ac6dcu1Zpw0j*******zlBnkdZ4
  insecure: true
  signature_version2: false
Create the object storage information required by the Prometheus Thanos sidecar.
## The default bucket secret name used by thanos is thanos-objstore-secret.
## To distinguish secrets on the same host, the Prometheus sidecar secret uses thanos-objectstorage.
kubectl create secret generic thanos-objectstorage --from-file=thanos.yaml=./thanos-storage-minio.yaml --namespace=monitoring
helm repo add https://charts.bitnami.com/bitnami
helm repo update
helm pull bitnami/kube-prometheus
tar -xf kube-prometheus-8.14.2.tgz
cd kube-prometheusModify the values.yaml content, roughly in the following two places. You can search and modify by filtering keywords with grep. All subsequent modifications are based on this and will not be repeated.
## kube-prometheus data persistence is mounted under nfs-client
global:
  storageClass: "nfs-client"

## Prometheus enables Thanos sidecar
prometheus:
  thanos:
    create: true
    objectStorageConfig:
	   secretName: "thanos-objectstorage"
	   secretKey: thanos.yaml
If deploying for the first time, you need to create the internal CRD configuration of kube-prometheus first.
kubectl create -f crds/*Do not use kubectl apply -f crds/*. Otherwise, there will be a Too long: must have at most 262144 bytes issue.
## After modification, deploy kube-prometheus
helm package ./
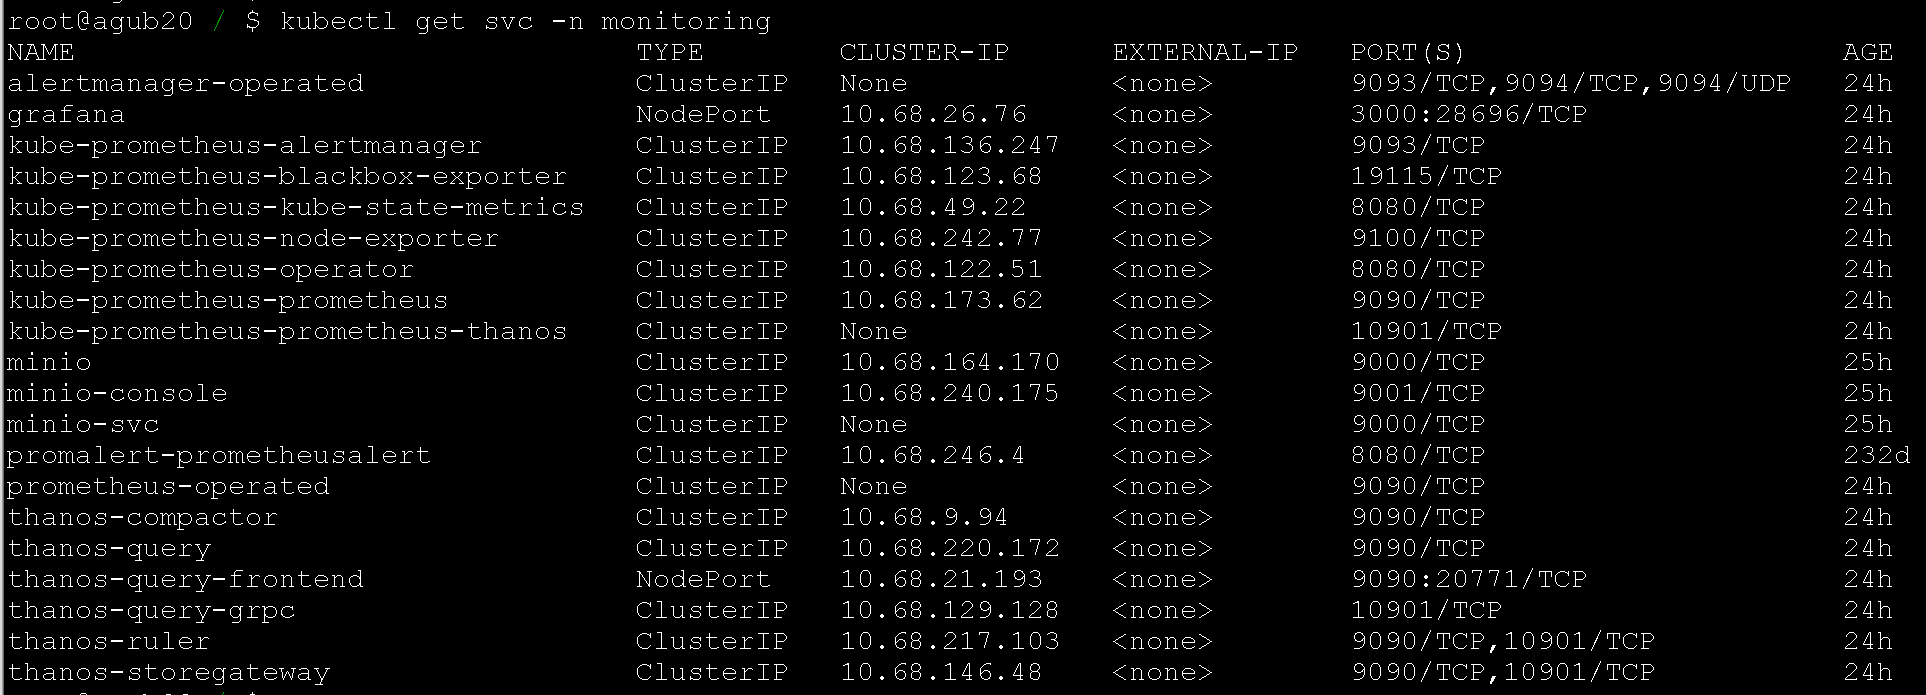
helm install kube-prometheus kube-prometheus-8.14.2.tgz --namespace=monitoringAfter enabling the sidecar thanos, the svc kube-prometheus-prometheus-thanos will appear.
root@agub20 ~* $ kubectl get svc -n monitoring |grep kube-prometheus
*******
kube-prometheus-prometheus-thanos    ClusterIP   None            <none>        10901/TCP                    22h
2.3 thanos
Use the access key and secret of the bucket named thanos created with Minio above.
## bitnami thanos deployment
## ruler, storegateway, compactor are disabled by default; set them to true to enable.
## Enabling ruler requires configuration.

helm pull bitnami/thanos
tar -xf thanos-12.8.3.tgz
cd thanos
Configure values.yaml, starting from the top with storageClass.
## Global configuration
## It is recommended to use only the global storageClass configuration; configure it in one place instead of individually, except for special cases.
global:
  storageClass: "nfs-client"

## If you don't want to use the global configuration, you can configure storageClass under the specific statefulset subdirectory, for example:
compactor:
  persistence:
    storageClass: "nfs-client"

storegateway:
  persistence:
    storageClass: "nfs-client"

ruler:
  persistence:
    storageClass: "nfs-client"
Configure storegateway in values.yaml
root@agub20 ~/helm3_cm_learning/thanos/3thanos_deploy/thanos $ grep objstoreConfig values.yaml -A 10
objstoreConfig: |-
  type: s3
  config:
    bucket: thanos
    endpoint: minio.monitoring.svc.cluster.local:9000
    access_key: 9PM45Ca5P****kPKQ2K2
    secret_key: X10ac6dcu1Zpw0j*******zlBnkdZ4
    insecure: true
    signature_version2: false
Configure a simple ruler config in values.yaml (example):
ruler:
  enabled: true
  alertmanagers: ["http://alertmanager-operated.monitoring.svc.cluster.local:9093","http://kube-prometheus-alertmanager.monitoring.svc.culster.local:9093"]
  config: |-
    groups:
      - name: "metamonitoring"
        rules:
          - alert: "PrometheusDown"
            expr: absent(up{prometheus="monitoring/prometheus-operator"})
After configuring values.yaml, deploy thanos
helm package ./
helm install thanos thanos-12.8.3.tgz --namespace=monitoring
Check
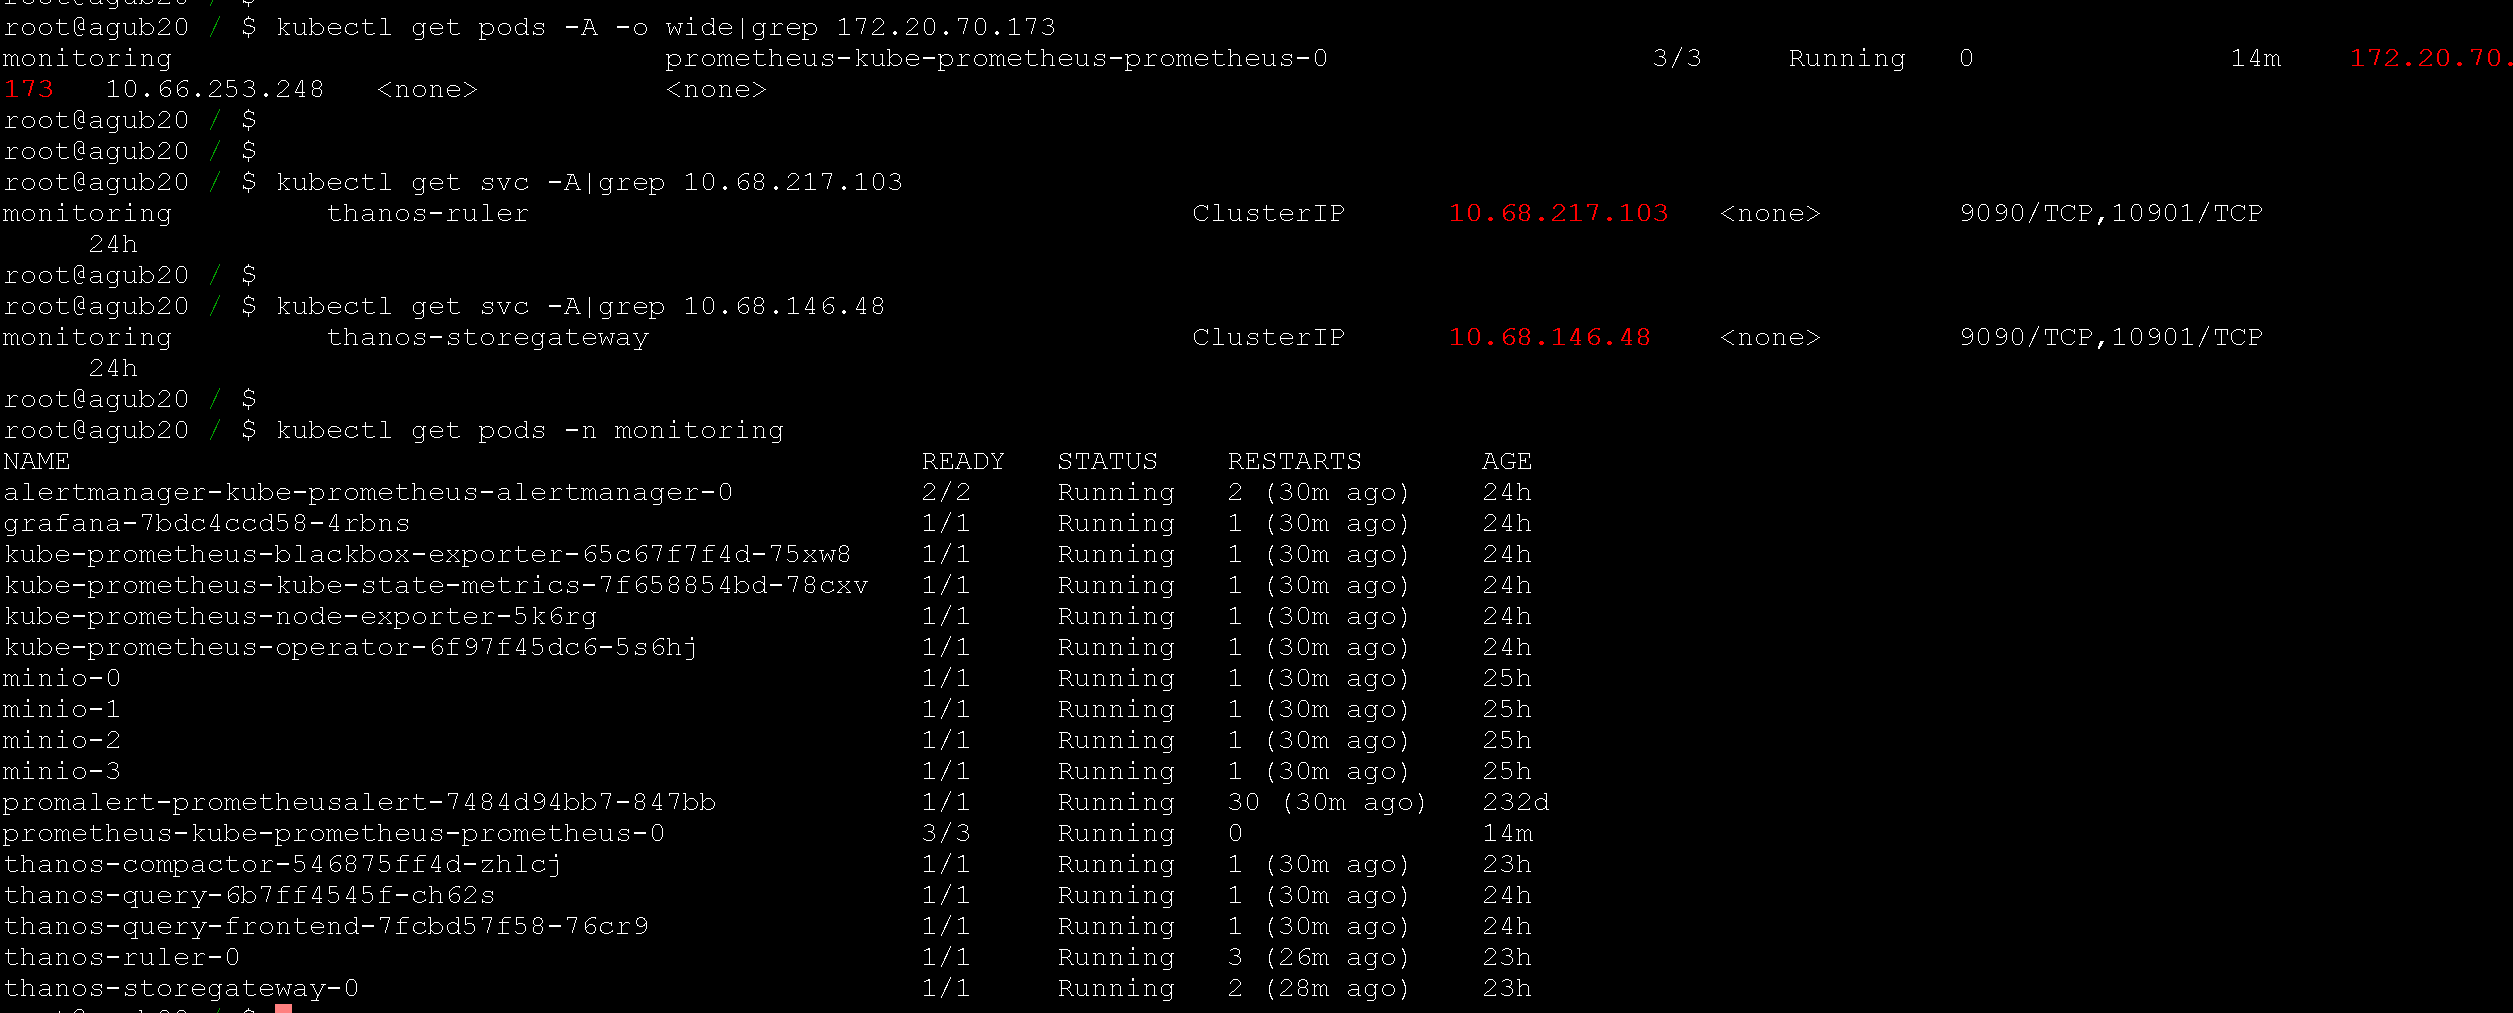
root@agub20 ~/$ kubectl get pods -n monitoring |grep thanos
thanos-compactor-546875ff4d-zhlcj 1/1 Running 0 21h
thanos-query-6b7ff4545f-ch62s 1/1 Running 0 22h
thanos-query-frontend-7fcbd57f58-76cr9 1/1 Running 0 22h
thanos-ruler-0 1/1 Running 0 21h
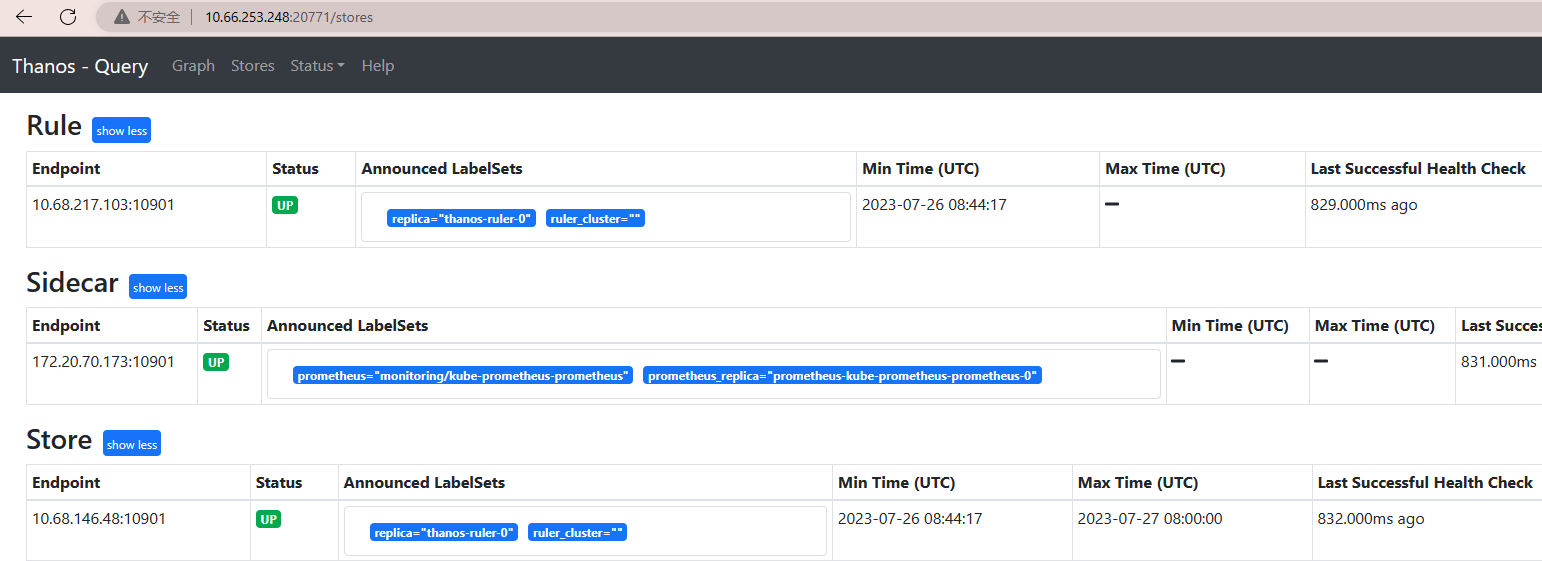
thanos-storegateway-0 1/1 Running 0 21hYou can configure ingress to access thanos-query-frontend. For temporary debugging, nodeport was used to access thanos-query-frontend.
2.4 grafana deployment
helm search repo grafana|grep bitnami
helm pull bitnami/grafana --version 8.4.6
tar -xf grafana-8.4.6.tgz
cd grafana
Modify content to add sc persistence. There are many configurable options such as admin password, explore as needed.
global:
  storageClass: "nfs-client"
helm package ./
helm install bitnami-grafana grafana-8.4.6.tgz --namespace=monitoringFor temporary debugging convenience, after deployment, nodeport is used to access the grafana web. Add thanos data source and dashboard to grafana.
datasource - prometheus: http://thanos-query.monitoring.svc.cluster.local:9090

node-exporter full dashboard id: 1860
thanos dashboard id: 12937
Official thanos multiple grafana dashboard json
3. References
Multi-cluster monitoring tool Thanos - Basic reading
Thanos official deployment options - I chose bitnami-thanos
thanos practice - valuable practical experience
Thanos deployment and practice - only the theoretical part at the beginning
Two data collection modes of thanos: sidecar and receiver
Comments